Multimorbidityのパターンについて。
Takuya Aoki, et al. Multimorbidity patterns in relation to polypharmacy and dosage frequency: a nationwide, cross-sectional study in a Japanese population.
- Scientific Reports 8(1).
Multimorbidityについて、日本人を対象とした論文。
18歳以上の3256名(うち外来患者1480名)を対象に、Multimorbidityパターンについて調査。
患者背景;
Table 1 Participants’ characteristics: N (%).
| Characteristic | Total participants (N = 3,256) | Outpatients* (N = 1,480) |
|---|---|---|
| Gender | ||
| Male | 1617 (49.7) | 752 (50.8) |
| Female | 1639 (50.3) | 728 (49.2) |
| Data missing | 0 | 0 |
| Age (year) | ||
| 18–29 | 525 (16.1) | 135 (9.1) |
| 30–44 | 840 (25.8) | 259 (17.5) |
| 45–64 | 1092 (33.5) | 499 (33.7) |
| 65–74 | 514 (15.8) | 357 (24.1) |
| ≧ 75 | 285 (8.8) | 230 (15.5) |
| Data missing | 0 | 0 |
| Education level | ||
| Less than high school | 107 (3.3) | 67 (4.5) |
| High school | 1249 (38.3) | 588 (39.7) |
| Junior college | 337 (10.4) | 142 (9.6) |
| More than or equal to college | 1423 (43.7) | 571 (38.6) |
| Data missing | 140 | 112 |
| Annual household income (million JPY) | ||
| <3.00 (≒27,000 US dollar) | 810 (24.9) | 402 (27.2) |
| 3.00–4.99 | 934 (28.7) | 443 (29.9) |
| 5.00–6.99 | 621 (19.1) | 250 (16.9) |
| 7.00–9.99 | 503 (15.4) | 210 (14.2) |
| ≧ 10.00 | 346 (10.7) | 143 (9.7) |
| Data missing | 42 | 32 |
| Number of morbidities | ||
| 0 | 1468 (45.1) | 245 (16.6) |
| 1 | 815 (25.0) | 461 (31.1) |
| ≧ 2 | 973 (29.9) | 774 (52.3) |
| Number of concurrent medications† | ||
| 0–4 | 2712 (83.3) | 968 (65.4) |
| 5–9 | 405 (12.4) | 401 (27.1) |
| ≧10 | 101 (3.1) | 101 (6.8) |
| Data missing | 38 | 10 |
| Number of doses per day | ||
| 0–2 | 2895 (88.9) | 1119 (75.6) |
| ≧ 3 | 351 (10.8) | 351 (23.7) |
| Data missing | 10 | 10 |
その結果、
Multimorbidityは29.9%に認められ、
65歳以上に限定すれば、62.8%に認められた。
外来患者1480名のうち、6.8%にポリファーマシーがあり、23.7%に過剰な投薬があった。
Multimorbidityパターンは、
大きく5つに分類できた。
パターン1:心血管・腎臓・代謝疾患~高血圧、糖尿病、脂質異常症、脳卒中、心臓疾患、腎臓疾患
パターン3:骨格・関節・消化器系疾患~関節炎やリウマチ、腰部疾患、消化器系疾患
パターン4:呼吸器・皮膚疾患~慢性呼吸器疾患、皮膚疾患
パターン5:悪性腫瘍・消化器・泌尿器~悪性腫瘍、消化器系疾患、泌尿器科系疾患
に分類できた。
これらのパターンが、下の表のFactorと対応しています。
Table 2 Factor loadings for the five-factor solution following an exploratory factor analysis in a general adult population* (N = 3,256).
| Factor1 | Factor2 | Factor3 | Factor4 | Factor5 | |
|---|---|---|---|---|---|
| Hypertension | 0.76 | −0.04 | 0.13 | −0.12 | −0.01 |
| Diabetes | 0.74 | −0.07 | −0.24 | 0.13 | 0.05 |
| Dyslipidemia | 0.58 | −0.06 | 0.18 | 0.04 | −0.14 |
| Stroke | 0.61 | 0.18 | 0.08 | −0.06 | 0.03 |
| Cardiac diseases | 0.40 | −0.21 | 0.11 | −0.02 | 0.19 |
| Chronic respiratory diseases | 0.02 | 0.06 | 0.01 | 0.68 | 0.02 |
| Digestive diseases | 0.05 | 0.18 | 0.45 | 0.09 | 0.30 |
| Kidney diseases | 0.37 | 0.10 | 0.12 | 0.13 | 0.29 |
| Urologic diseases | −0.03 | −0.02 | −0.02 | −0.01 | 0.97 |
| Arthritis & rheumatism | 0.08 | −0.34 | 0.46 | 0.10 | −0.01 |
| Lumbar diseases | 0.03 | 0.01 | 0.81 | 0.03 | 0.01 |
| Neurologic diseases | 0.19 | 0.36 | 0.18 | 0.21 | 0.14 |
| Mental disorders | −0.01 | 0.60 | 0.19 | 0.24 | 0.00 |
| Endocrine diseases | 0.25 | −0.31 | −0.03 | −0.10 | 0.15 |
| Malignancy | 0.08 | −0.01 | 0.08 | −0.02 | 0.45 |
| Vision abnormalities | 0.16 | −0.58 | 0.26 | 0.23 | 0.13 |
| Skin diseases | −0.10 | −0.05 | −0.02 | 0.62 | −0.01 |
本文からは脱線しますが、
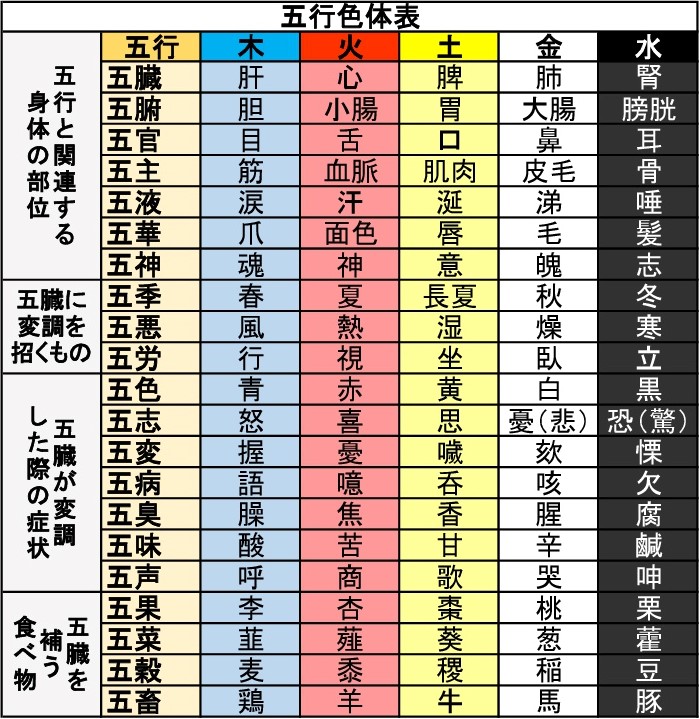
5つのパターンと五行色体表は関連があるようにみえます。
一番分かりやすいのが、パターン4の呼吸器と皮膚疾患
「肺は皮毛を司る」ので、肺の影響は皮膚に現れるということ。
他のパターンも同様の傾向にあるかも。

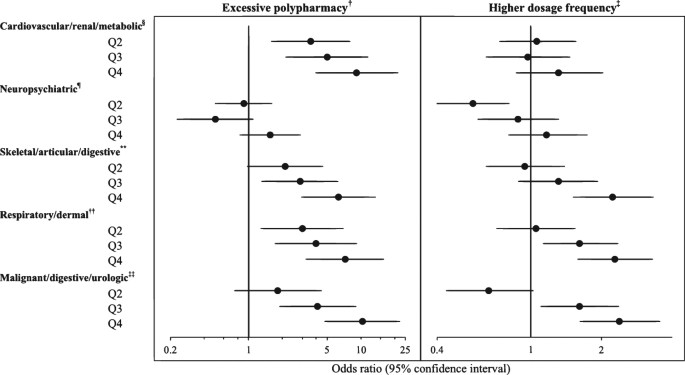
外来患者のMultimorbidityパターンと投薬の関係を調べたところ、
パターン1:心血管・腎臓・代謝疾患;Odds比9.22
パターン5:悪性腫瘍・消化器・泌尿器;Odds比10.30
は、excessive polypharmacy(処方薬もしくはOTCが10種類以上ある)と強く関連し、
パターン2:神経・精神疾患
パターン3:骨格・関節・消化器系疾患
パターン4:呼吸器・皮膚疾患
はHigher dosage frequency(1日3回以上の投薬)と関連する。

今回の5つのパターンをもとに主訴との関連を探っていく方法もあるのかもしれません。
また東洋医学的な考え方とこうしたパターンの関連性をみていっても面白い発見があるのかもしれません。
しかし、今回の概念は近年発展しつつあるのですが、まだ正直よく理解できてないところもあるので、もう少し読み込まないとだめですね。